\gdef\R{\mathbb{R}} \gdef\p#1{({#1})} \gdef\norm#1{\lVert{#1}\rVert} \gdef\set#1{\mathcal{#1}} \gdef\setb#1#2{\{{#1} \mid {#2}\}} \gdef\dummyarg{\operatorname{-}}
n-sphere
\gdef\S{\mathrm{S}} \gdef\darc{d_{\mathrm{arc}}} \gdef\a#1#2{\mathrm{A}_{#1}\p{#2}}
Let \mathrm{S}_n(r) be an n-dimensional hypersphere, or n-sphere, of radius r centered at the origin:
\begin{align} \mathrm{S}_n(r) = \setb{\vec x ∈ \R^n}{\norm{\vec x}_2 = r} \end{align}
The volume and surface area of are given by formulas involving the Gamma function Γ\p{\dummyarg}:
\begin{align} \mathrm{V}_{n}\p {r} &= \frac{π^{\frac n2}}{\mathrm{Γ}\p{\frac n2 + 1}} r^n &&& \a{n}{r} &= \frac{2 π^{\frac n2}}{\mathrm{Γ}\p{\frac n2}} r^{n-1} \end{align}
When the radius is left out it is implied to be one, so S_n, V_n and A_n are the unit n-sphere and its volume and surface area respectively.
Distance Metrics
There are two commonly used distance functions on the unit n-sphere, the chord distance, d_{\mathrm{chord}}, and arc length d_{\mathrm{arc}}.
The chord length is simply the metric inherited from the surrounding \R^n space
\begin{align} d_{\mathrm{chord}}(\vec a, \vec b) = \norm{\vec a - \vec b}_2 \end{align}
The arc length, \darc, or great-circle distance, is the length of the shortest path between two points on \S^n. In one dimension \S^1 = \set{-1, 1} and \darc is ill-defined because there is no connecting path on \S^1. A natural extension in this case is to define \darc ∈ \set{0, \pi}. We can compute \darc as
\begin{align} \darc\p{\vec a, \vec b} = \cos^{-1}\p{\vec a ⋅ \vec b} \end{align}
While not technically a distance function, another popular function is the 'cosine distance':
\begin{align} d_{\mathrm{cos}}(\vec a, \vec b) = 1 - \vec a ⋅ \vec b \end{align}
We can geometrically interpret the various distances by considering the plane spanned by \vec a and \vec b intersecting \mathrm{S}_n:
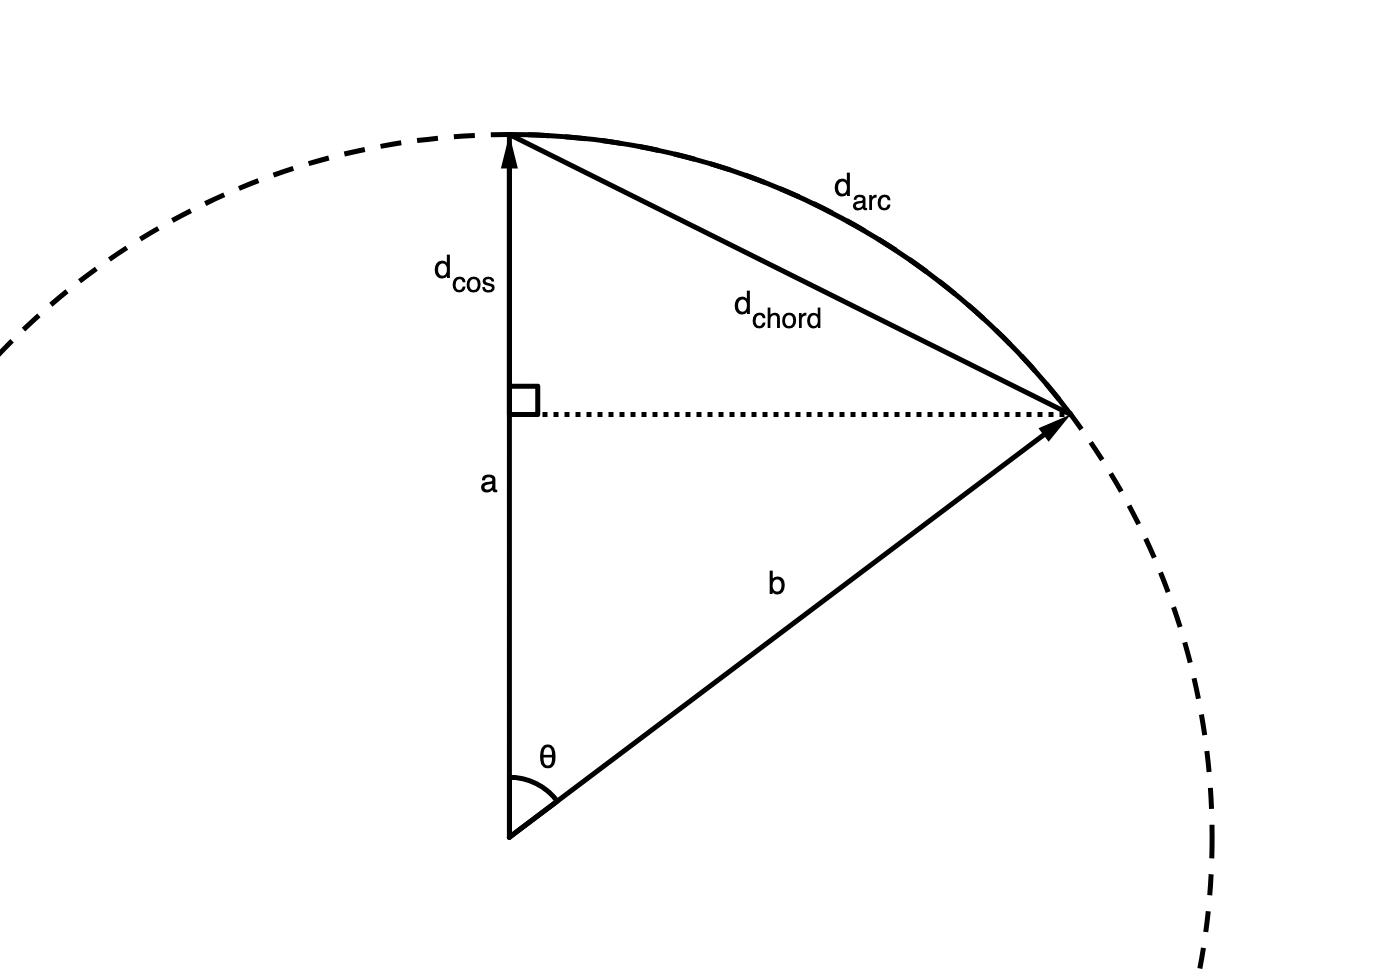
The distances d_{\mathrm{arc}} and d_{\mathrm{chord}} are related by
\begin{align} d_{\mathrm{chord}} &= 2 \sin\p{\frac{d_{\mathrm{arc}}}{2}} &&& d_{\mathrm{arc}} &= 2 \sin^{-1}\p{\frac{d_{\mathrm{chord}}}{2}} \end{align}
for small distances they are good approximations of each other with an error of O(d^3).
\darc Distribution
Consider the uniform distribution on the n-sphere. Uniform here taken to mean the natural Lebesgue measure. An elegant procedure to sample from this distribution is by generating standard normal random vectors and normalizing them:
def sample_sphere(count=1, n=1, r=1, rng=..()):
x = rng.((,))
return r * x / np.linalg.(, axis=1)[:, np.newaxis]Draw a pair of vectors \vec a, \vec b from the unit n-sphere and consider their distance d_{\mathrm{arc}}\p{\vec a, \vec b}. Let's do this numerically by generating many distances and plotting the histogram. We do this for a number of dimensions to see how the distribution evolves:
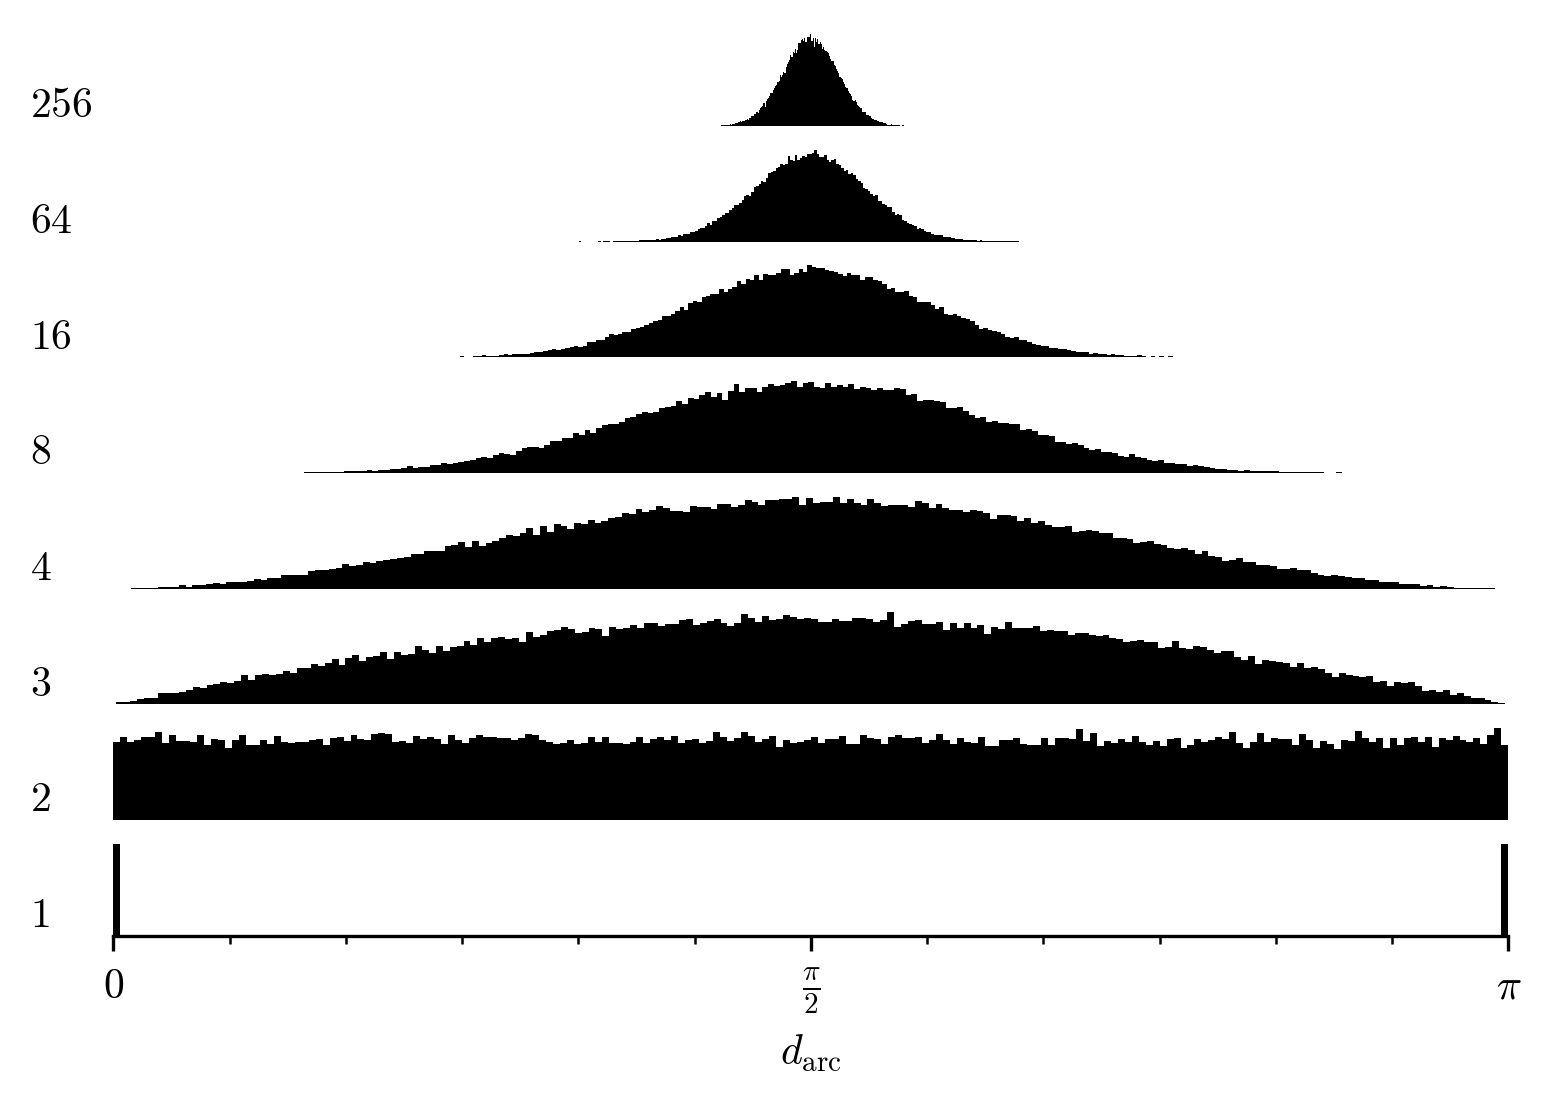
We see the exceptional bimodal behaviour in one dimension, in two dimensions the distances are uniformly distributed, and with higher dimensions the distribution converges to \frac π2. The value \frac π2 is the distance from a pole to the equator. Intuitively as we increase the number of dimensions there will be more space orthogonal to a given vector.
My first guess was a Beta distribution with parameters α = β = n - 1. This matches the behaviour at dimensions 1 and 2, and behaves similarly for higher dimensions. Unfortunately, for n=3 and higher it is very subtly wrong, as can be seen when we overlay it on a high resolution histogram
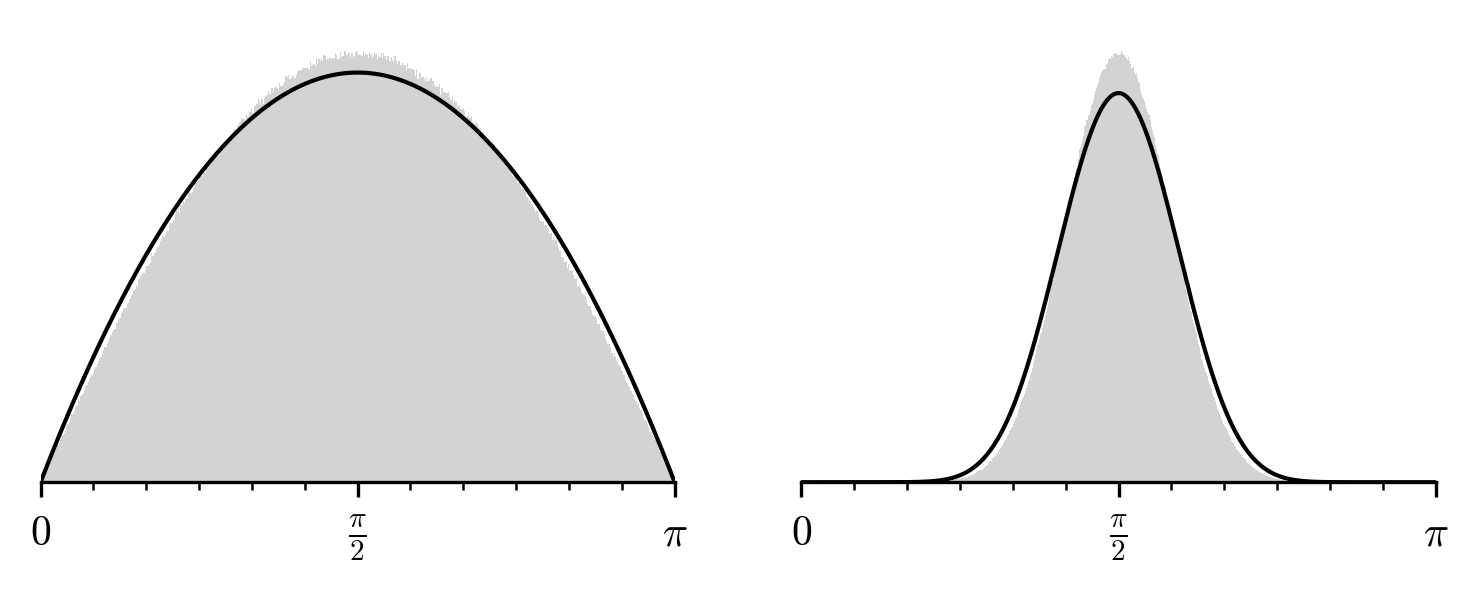
So let's find the true distribution. Given a point \vec a ∈ \S^n, the set of points a distance d away from \vec a is a n - 1-sphere of radius \sin d, that is \S^{n-1}\p{\sin d}. The infinitesimal probability of hitting this set is (see appendix for derivation)
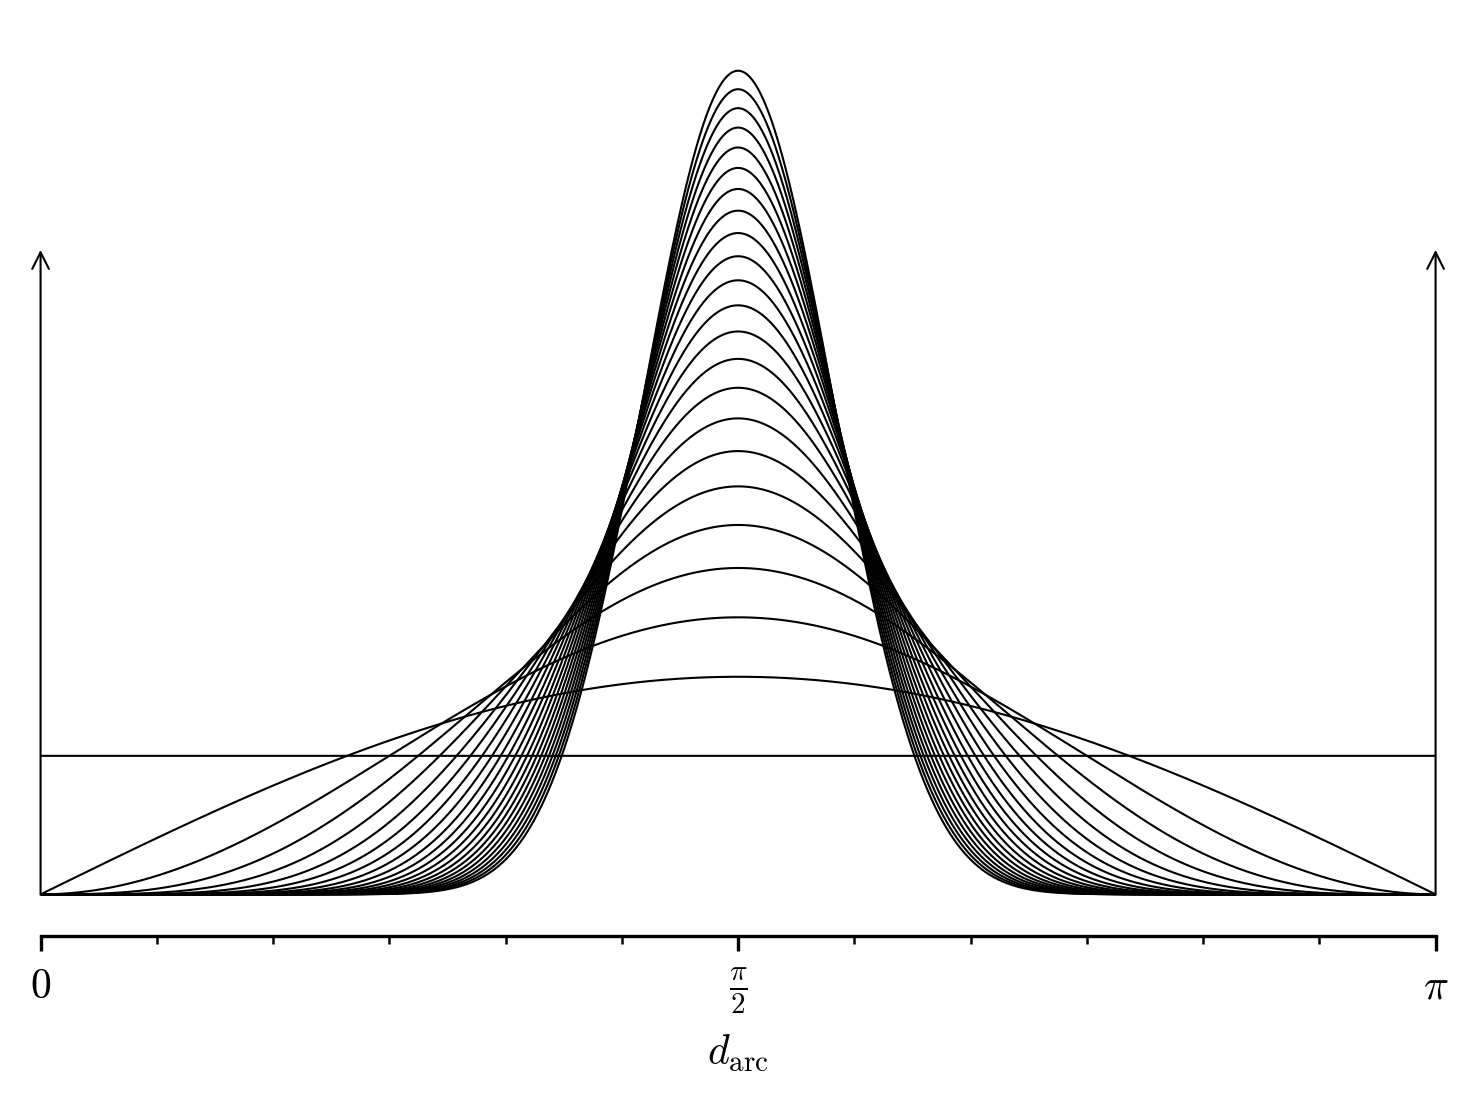
\begin{align} f_n(d) &= \frac{\a{n-1}{\sin θ}}{\a{n}{1}} =\frac{\sin^{n-2} d}{Β\p{\frac 12, \frac n2 - \frac 12}} \end{align}
where Β is the Beta function
\begin{align} Β\p{a,b} = \frac{Γ\p{a} Γ\p{b}}{Γ\p{a + b}} \end{align}
For consecutive values of n the probability density function f_n\p{\darc} looks like
References
- S. Li (2011). Concise Formulas for the Area and Volume of a Hyperspherical Cap. https://dx.doi.org/10.3923/ajms.2011.66.70
- Panagiotis Sidiropoulos (2014). N-sphere chord length distribution. https://arxiv.org/abs/1411.5639v1
- J.C. Baez, G. Egan, J.D. Cook, D. Piponi (2018). Random Points on a Sphere (Part 1) https://johncarlosbaez.wordpress.com/2018/07/10/random-points-on-a-sphere-part-1/
Appendix: Derivation
\begin{aligned} f_n(d) &= \frac{\a{n-1}{\sin θ}}{\a{n}{1}} = \frac{\p{ \frac{2 π^{\frac{n-1}{2}}}{\mathrm{Γ}\p{\frac {n-1}{2}}} \p{\sin θ}^{n-2} }}{\p{ \frac{2 π^{\frac n2}}{\mathrm{Γ}\p{\frac n2}} 1^{n-1} }} \\&= \frac{1}{\sqrt{π}} \frac{\mathrm{Γ}\p{\frac n2}}{\mathrm{Γ}\p{\frac {n-1}{2}}} \sin^{n-2} θ =\frac{\mathrm{Γ}\p{\frac n2}}{\mathrm{Γ}\p{\frac 12}\mathrm{Γ}\p{\frac n2 - \frac 12}} \sin^{n-2} d \\&= \frac{\sin^{n-2} d}{Β\p{\frac 12, \frac n2 - \frac 12}} \end{aligned}